US economy will bend, not break
Since the start of 2016, investors have grappled with market volatility spurred by concerns about China, oil prices, the strength of the US dollar and Federal Reserve policy.
The recent equity market correction has raised concerns about the risk of a US recession.
However, global equity market corrections tend to produce false recession signals, and we believe the current market volatility was such an occurrence. History shows a mixed track record for the market in predicting recessions, with as many hits as misses since 1960.
US equity market's mixed track record of forecasting recessions
Comparing yearly S&P 500 Index returns with actual US recessions
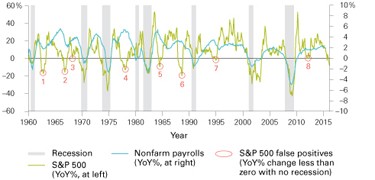
Notes: The National Bureau of Economic Research defines a recession as "a significant decline in economic activity spread across the economy, lasting more than a few months, normally visible in real GDP [gross domestic product, real income, employment, industrial production and wholesale-retail sales" (2016; available on www.nber.org/cycles.html). YoY = year over year.
Sources: Calculations by The Vanguard Group, Inc., based on data from US Bureau of Labor Statistics household surveys (1960 - 2015), NBER and Standard & Poor's.
Yield curve is still a reliable indicator
Perhaps the best-known market-based indicator for predicting downturns is the slope of the US
Treasury yield curve (that is, the yield spread between long-term and short-term Treasuries). Past US recessions have been preceded by a significant "flattening" of the yield curve, in some cases as early as 18 months before the recession begins.
Contrary to conventional wisdom, it is the "flattening" of the yield curve itself, rather than its inversion, that is most predictive of a recession. With short-term rates near 0%, the 10-year Treasury yield would need to drop below 1% to signal a forthcoming recession, or well below current yield levels.
Overall, financial markets-based models tend to assign higher probabilities of recession, but have much lower predictive power than macro fundamental models such as Vanguard's.
A mixed bag for market-based forecasts; macro fundamental models are more reliable
Estimated ability of various models to predict a US recession over six months ended August 2016
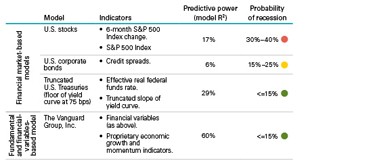
Notes: Figure based on results of probit model accounting for credit default spread (AAA interest rates minus Baa interest rates), yield curve (10-year Treasury yield minus 3-month T-bill yield), proprietary economic growth and momentum indicators as included in Vanguard's leading economic indicators (VLEI). The VLEI comprises more than 70 economic indicators covering all sectors of the real US economy, such as manufacturing, housing, and trade; hard indicators including sales and profits; and soft indicators such as surveys and market sentiment. The model is specifically designed to anticipate turning points in the business cycle and slowdowns in payroll growth.
Sources: The Vanguard Group, Inc. calculations, based on data from Federal Reserve Bank of St. Louis, Moody's Analytics Data Buffet, Moody's Investors Service, NBER, Standard & Poor's, Thomson Reuters Datastream and US
Board of Governors of the Federal Reserve System.
A US 'growth scare' is likely, but not a recession
The Vanguard Group, Inc.'s recession model (see Figure 2) combines financial variables with proprietary leading economic indicators, a coverage that tends to produce a more reliable signal. Today, The Vanguard Group, Inc.'s model puts the probability of an outright US recession over the next six months at roughly 10%. This outlook is less bearish than is indicated by the financial markets, given the underlying momentum in the labour market. Our model does detect elevated odds of a "growth scare" - a slowdown in job growth - later in 2016.
This is one of the reasons we anticipate the US Federal Reserve to raise rates to 1% this year and then pause as the pace of US job growth cools. This view is not currently priced in by the US bond market, which sees little if any further tightening in 2016.
Odds of a US recession remain low
The Vanguard Group, Inc. model estimates are based on both fundamental and market variables
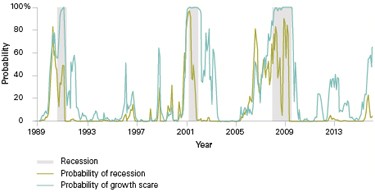
Notes: Figure based on results of probit model accounting for credit default spread (AAA interest rates minus Baa interest rates), yield curve (10-year Treasury yield minus 3-month T-bill yield), proprietary economic growth and momentum indicators as included in The Vanguard Group Inc.'s leading economic indicators (VLEI), and results of S&P 500 Index. Recession is as defined by NBER (see Notes to first Figure 1); we define "growth scare" as a fall in monthly nonfarm payrolls below 50,000. Estimates based on data from January 1982 through January 2016.
Sources: Calculations by The Vanguard Group, Inc., based on data from Federal Reserve Bank of St. Louis, Moody's Analytics Data Buffet, Moody's Investors Service, NBER, Standard & Poor's, Thomson Reuters Datastream and US Board of Governors of the Federal Reserve System.
Growth scare par for the course?
As the US labour market closes in on full employment, we expect the pace of job growth to slow and approach demographic trends of approximately 150,000 or fewer jobs per month. If this view is correct, we would anticipate some weaker-than-consensus jobs reports in 2016. We would see such short-term deviations as par for the course as the economy returns to lower trend job growth, rather than a sign of an imminent recession.
Market volatility will surely increase, should such events unfold, but our baseline view remains that the US economy is unlikely to break and fall into recession in 2016.
Convergence towards trend labour-force growth will not be linear
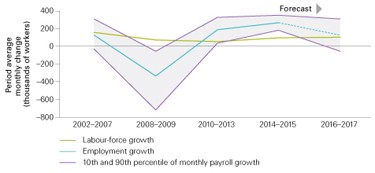
Notes: Data cover 2002 - 2017. Labour-force growth represents historical average monthly change in labour force; 2016 - 2017 period represents a projection using population growth estimates and assumes constant participation rates within age cohorts. Employment growth is assumed to return to trend in labor force growth over 2016 - 2017.
Sources: Calculations by The Vanguard Group, Inc., based on data from Congressional Budget Office, US Bureau of Economic Analysis, US Bureau of Labor Statistics and Moody's Analytics Data Buffet.
Vanguard | 11 April 2016
Latest Newsletters
Hot Issues
- Aged care report goes to the heart of Australia’s tax debate
- Removed super no longer protected from creditors: court
- ATO investigating 16.5k SMSFs over valuation compliance
- The 2025 Financial Year Tax & Super Changes You Need to Know!
- Investment and economic outlook, March 2024
- The compounding benefits from reinvesting dividends
- Three things to consider when switching your super
- Oldest Buildings in the World.
- Illegal access nets $637 million
- Trustee decisions are at their own discretion: expert
- Regular reviews and safekeeping of documents vital: expert
- Latest stats back up research into SMSF longevity and returns: educator
- Investment and economic outlook, February 2024
- Planning financially for a career break
- Could your SMSF do with more diversification?
- Countries producing the most solar power by gigawatt hours
- Labor tweaks stage 3 tax cuts to make room for ‘middle Australia’
- Quarterly reporting regime means communication now paramount: expert
- Plan now to take advantage of 5-year carry forward rule: expert
- Why investors are firmly focused on interest rates
- Super literacy low for cash-strapped
- Four timeless principles for investing success
- Investment and economic outlook, January 2024
- Wheat Production by Country
- Time to start planning for stage 3 tax cuts: technical manager
- Millions of Australians lose by leaving savings in default MySuper funds
Article archive
- January - March 2024
- October - December 2023
- July - September 2023
- April - June 2023
- January - March 2023
- October - December 2022
- July - September 2022
- April - June 2022
- January - March 2022
- October - December 2021
- July - September 2021
- April - June 2021
- January - March 2021
- October - December 2020
- July - September 2020
- April - June 2020
- January - March 2020
- October - December 2019
- July - September 2019
- April - June 2019
- January - March 2019
- October - December 2018
- July - September 2018
- April - June 2018
- January - March 2018
- October - December 2017
- July - September 2017
- April - June 2017
- January - March 2017
- October - December 2016
- July - September 2016
- April - June 2016
- January - March 2016
- October - December 2015
- July - September 2015
- April - June 2015
April - June 2016 archive
- Making investing a family affair
- Super and divorce: a personal finance issue
- Market Update - May 2016
- ASIC flags SMSF investors in scam risk
- Older, greyer and still working
- Working and contributing to super past 65
- The pitfalls of part-year pensions
- Replenishing SMSF memberships
- Budget will hit 15% of SMSFs
- The insidious side of low interest rates
- Market Update - April 2016
- Budget 2016-17
- Do investment principles stand test of time?
- Estate Planning - early inheritance
- US economy will bend, not break
- A detailed look at the ATO’s new LRBA guidance
- Defying life's blueprint
- ATO continuing lodgement crackdown
- Another twist on the gender savings gap
- Market Update – March 2016
- Going solo
- Use our online budgeting tools to help plan your future.
- Age Pension means-test prevents rational decision-making
- Changing times for super collectables
- Preservation Age Rule
- Why investing for retirement isn't just about super